Emissions Factor Matching Using Machine Learning

Introduction
At CarbonBright, we have changed the process of creating product-level Life Cycle Assessments (LCAs) from time-consuming and expensive to fast and easy. This is the first in a series of technical posts that shed light on how we are leveraging AI and machine learning technologies behind the scenes to make this happen.
In the LCA process, the values of emission factors for an activity are used to determine the amount of a pollutant released into the environment. We source these from various databases, both public and commercial/proprietary ones. Even for experts, searching for the correct emissions factor through a database of thousands of potential options can quickly become a needle in a haystack scenario. Not only do you have to consider the material or product ingredient, but the geography and manufacturing processes must also be considered.
There are keyword-based searches that are supported by many tools. Still, they need to consider the classification of chemicals and ingredient synonyms. It again burdens the user to dive into the scientific literature and research the classification of chemicals and ingredient synonyms to find the Goldilocks emission factor.
Our Approach
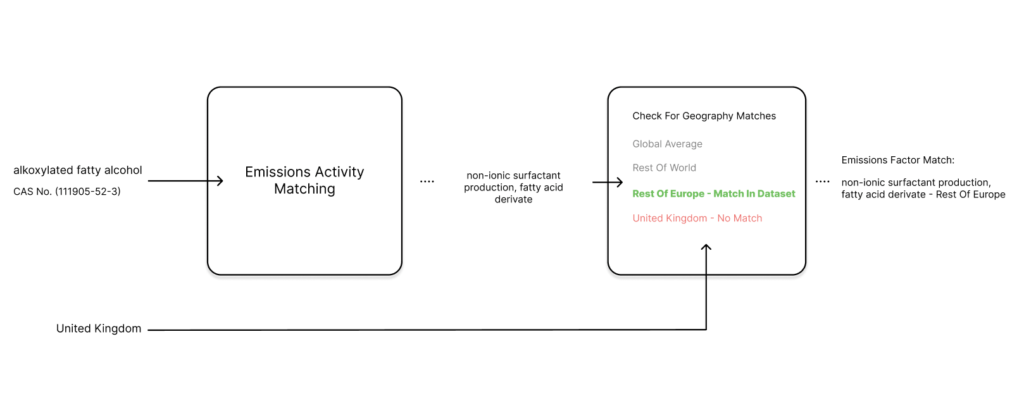
Here, we describe the steps we take to match emission factors for product ingredients used to make a product. We have subdivided the model used for matching into two parts. The first part matches emissions and activities, and the second part finds the closest geography. For example, in case of an ingredient “alkoxylated fatty alcohol” sourced from United Kingdom. The first part matches with activity of “non-ionic surfactant production, fatty acid derivative”. The second matches with the closest geography, which in this case is “Rest of Europe”.
Our emissions factor database has 10s of thousands of entries. The first step is to limit the search space to the ingredient category. In the case of chemical ingredients, it gets limited to a fraction of the entire database.
Emissions Activity Matching
The next step is to find the emissions activity that is the most appropriate match for the product ingredient. For this step, we require the input of an ingredient name and augment that with the CAS number (the unique number given by the CAS registry for chemical ingredients) when available. We use a special tool from the field of Artificial Intelligence (AI) called a “BERT transformer”. This tool has been trained on a vast library of chemical and scientific texts. We then create “embeddings” for each emissions activity. This is a way of turning the descriptions and details the emission factor database provides into a form that we can easily compare for similarity.
Most chemical sector entries in our database have a CAS number associated with them. This makes the task far more accessible in the case that the CAS number supplied has a direct match to entries in the Ecoinvent dataset. For these instances, we query all the rows that match the CAS number and perform the cosine similarity method we will use in a second to find the most appropriate activity.
Suppose there is no match for a CAS number. In that case, we fall back to computing the similarity score between the embedding for the chemical name and some other added context to perform some heavy lifting and the embedding for the activity we produced prior.
Finally, we selected the activity with the highest Cosine similarity as the most appropriate activity. In this process, we prioritize a CAS number match. Still, if not found, we rely solely on the power of pre-trained transformers to embed both the emissions activity and the chemical name with some additional contexts and then compare how similar those embeddings are.
Geography Matching
Finding the correct activity is only half the battle; geography can significantly affect the difference between two emissions factors. Standards for electricity and water, manufacturing methods, as well as socioeconomic factors, can lead one country’s emissions factor for an activity to be significantly higher or lower than another country.
The database has a hierarchy for geography. For some activities, emission factors are not available for every country, while it might be available at a larger geographic level (such as a continent). This hierarchy resembles a tree structure with nodes at each level with siblings and parents. A parent node, for example, “Rest of the World,” is a more appropriate choice for the ideal selection of “Rest of Europe” than a sibling node, “Rest of Oceana.”
First, this requires that we construct a tree of the whole world. Starting with the global average, followed by “Rest of the world,” the continent-specific values, and finally, the leaf nodes, which are the countries in each continent.
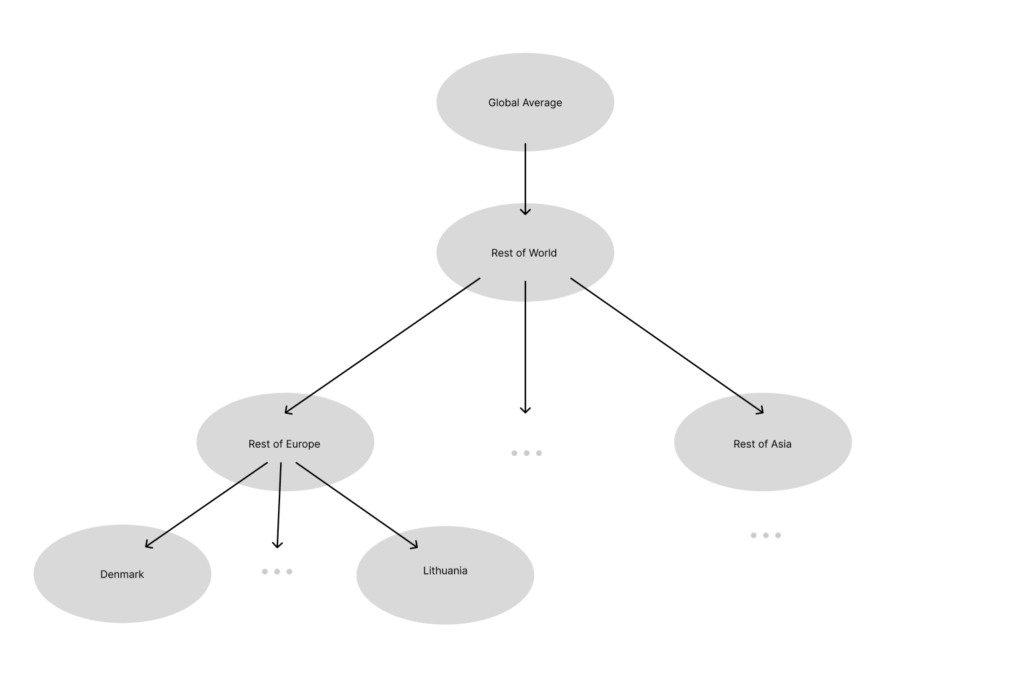
After inputting the desired geography and the activity name, we search the hierarchy for a match in our dataset. If there is no match at the current level, we check the parent node, and so on, until we find an appropriate match. In some cases, there is no match in this traversal. There have been some instances where a sibling node has a match but none of the parents. In such cases we select the emissions factor in the dataset for the given activity with the closest sibling geography.